Kafka Streams scales by dividing the work. Each partition of the input becomes
a task.
The tasks are spread over the
stream threads
of all the instances that share an application.id.
Add an instance, or raise
num.stream.threads,
and the group hands the new threads some of the tasks.
The threads share no state, so they need no coordination among themselves. The
consumer group coordinates them instead. It distinguishes a working thread from
a stuck one by the poll: a thread has to call
poll()
at least every
max.poll.interval.ms.
If it does not, the group
rebalances.
It takes the thread’s tasks away and hands them to the others.
A rebalance has a cost. Whatever a thread had done since its last commit is done again by the next owner of its tasks. A stateful task that moves to another instance cannot resume until its state stores are restored from their changelog topics. Kafka’s docs name that restoration as the main cost of moving a task (Fault Tolerance). A standby replica shortens it. Another instance keeps a copy of the state up to date, and the task moves there. Standbys are off by default.
When you add an instance, the rebalance that follows is worth its cost. When a slow thread causes one, it is best avoided. This post is about the second kind.
Polling in time is easy while each record takes microseconds or milliseconds. A remote call changes that. Each record takes as long as the service takes to answer, or until a timeout cuts the call off. The thread waits either way. This is not yet the common case for Kafka Streams, and the standard advice is not to block a stream thread at all. On the other hand, we expect such calls to become more common. More teams now call external services on events as they arrive: an AI model’s API above all, but also a scoring service, or anything else that answers in seconds.
A service’s answer time also changes over the day. It answers quickly when it is quiet and slowly when it is busy. It is often busiest just when your stream has the most to send it. A slow service is a known hazard. A service that becomes slow is a different one. It hurts the threads that had been keeping up, not the ones that were already behind. We come to why later in the post.
The usual reading is that max.poll.interval.ms bounds one call. Keep each call
under it, and the thread keeps its tasks. It bounds something larger. On Kafka
Streams 4.2.0, we saw threads evicted from the group even though every call
took well under the poll interval. Here is what we found, with the section that
shows each:
- The poll interval bounds more than one call. A thread with several tasks makes a call for each of them between two polls (the round).
- A thread that had been fast was evicted again and again once its service slowed, at the default settings (a fast thread’s service slows down).
Two things depend on the group, not the thread. A rebalance opened by another member can evict a thread whose settings are safe. And under Kafka’s newer streams protocol, what an eviction costs depends on who else is in the group. Both are measured in a coming post.
We measured each case in a run, and predicted each run before it ran. Every run
used a single machine with one broker and a stub HTTP service whose
latency we set. Every run used the classic group protocol, Kafka Streams’ default
group.protocol.
A
mapValues
called it and blocked until it answered. The use case is illustrative: a stream
that sends each new security advisory, a CVE, to a service that scores it. The
records were real, newly published CVEs, replayed from one captured window. The
numbers describe the shape of the problem, not your cluster. The method, and the
predictions that were wrong, are in
How the numbers were made.
The stream thread’s loop
Matthias J. Sax explains the stream thread’s loop in his talk The Nuts and Bolts of Kafka Streams. From about nine minutes in, he covers the buffers, the bursts of records per task and why their size is adjusted. We build on his picture and follow one case: what that adjustment does to a thread whose every record waits on a slow call.
Between two polls, the thread has work that comes due. A commit is due once the commit interval has passed, and a poll before the poll interval runs out. A punctuation is due when it is scheduled. Checking for due work after every record would cost time. Checking too rarely would make that work late. So the thread works in passes of up to N records per task and checks after each pass. While nothing is due, it adds one to N, and the passes grow. When something comes due, it halves N, so the next check comes sooner. It is the rule TCP uses for its congestion window: grow slowly, back off fast. The rule assumes a record is cheap, microseconds or milliseconds. A remote call breaks that assumption. The rest of this post follows what happens then, and which settings keep a thread in its group.
A poll hands its records to queues, one for each task and input partition.
When a queue holds more than
buffered.records.per.partition
records, 1,000 by default, its partition is paused
(StreamTask).
The thread stops fetching from it until the queue is back within the limit. It
still has to poll in time. In a pass, the tasks take turns. Each runs up to N
records from its queue, one after another, before the next task starts
(TaskExecutor).
With three tasks, A, B and C, and N at 2, a pass runs two records from each in
turn: A, A, B, B, C, C.
After each pass, the thread decides what comes next
(StreamThread, lines 1298 to 1320).
The loop: what a stream thread does after each pass, in Kafka Streams 4.2.0.
after each pass:
  run any punctuation that is due
  commit, if commit.interval.ms has passed on the commit clock
  if the pass processed nothing:
      go back and poll
  else if the time since the last poll is past half of max.poll.interval.ms:
      halve N, and go back and poll
  else if the pass committed or punctuated:
      halve N, and run another pass
  else:
      add one to N, and run another pass
The figure below follows the loop for three tasks at the default settings. Each call takes 40 seconds, longer than most, so that every pass is wide enough to see. Every pass takes longer than the 30-second commit interval, so every pass ends in a commit. Each commit halves N, and N never drops below 1, so each pass runs one record per task. The first pass ends at 120 seconds, short of the half-way mark, and the thread runs another. The second ends at 240 seconds, past the mark, and the thread polls with 60 seconds to spare.
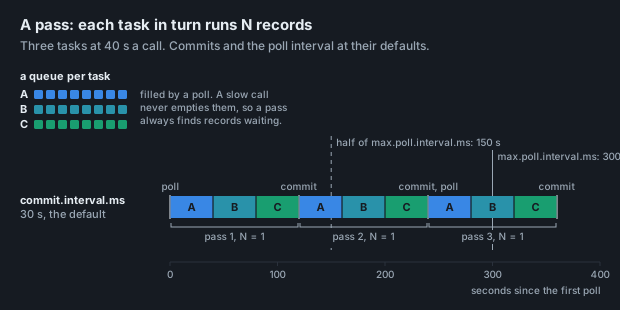
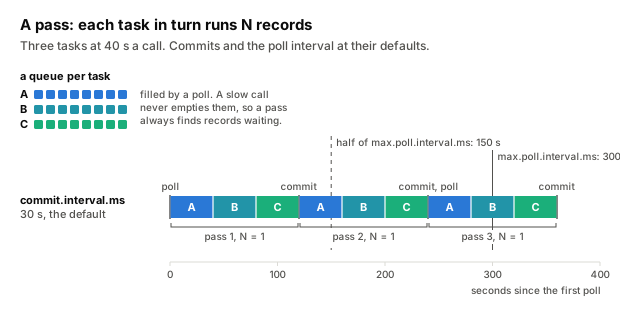
Almog Gavra’s Kafka Streams 101 on configs names the half-interval check. Two facts the rest of this post leans on are less known. N starts at 1 when the thread starts (line 877) and is never reset. It is carried from one poll to the next and, as we will see, across a rebalance. And a pass processes nothing only when none of its tasks has a record it can process. With a slow call and a backlog there always is one, so only the half-interval check sends the thread back to poll.
This is the default loop of 4.2.0. A second one, with processing threads, sits behind an internal flag that defaults to false. The code itself describes it as incomplete, and nothing here applies to it.
The unit is the round
A thread polls only after a whole pass, so what has to fit inside
max.poll.interval.ms is not one call. It is at least one record of each of
the thread’s tasks, one after another. We call that a round: with T tasks on a
thread and a call of L seconds, about T x L. A. Sophie Blee-Goldman put it in
one sentence in
Kafka Streams 101: Optimizing your apps:
a thread makes progress as long as it processes one record per task within the
poll interval.
The round grows with the tasks on a thread, as the figure below shows. An input topic of 32 partitions gave a single thread 32 tasks, and a round of 32 calls. With 32 threads, each had one task, and a round of one call.
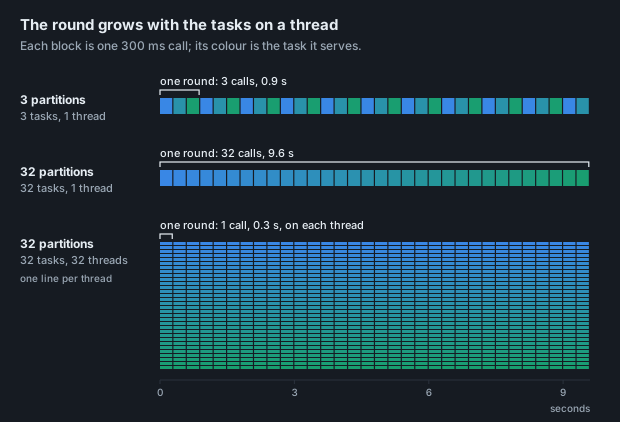
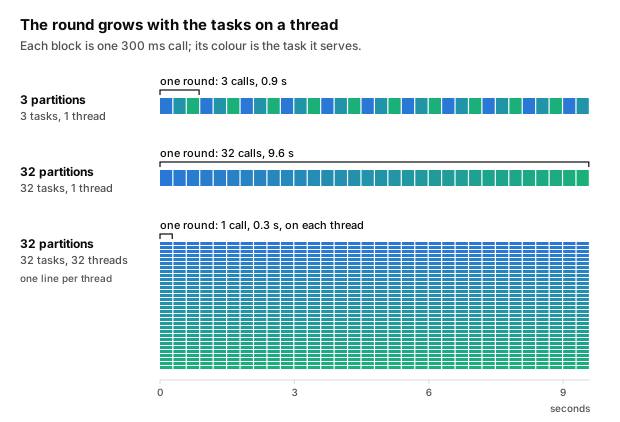
In the figure above, every round fits the poll interval with room to spare, so a slow call costs only throughput. A round longer than the poll interval costs more. To show it, we set up a case on purpose: three tasks on one thread, a 12-second call, and a 30-second poll interval, so a round takes 36 seconds. The figure below draws its first pass. Every call fits well inside the poll interval, even inside half of it. The round does not, and at 30 seconds the client leaves the group.
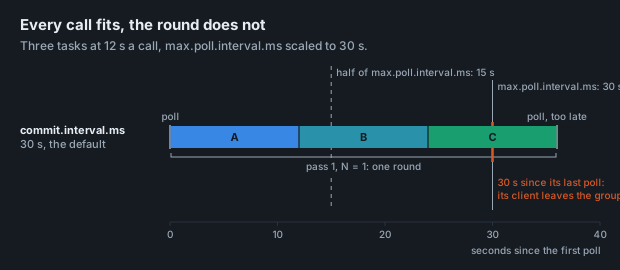
We stopped the run after 210 seconds. In that time the thread was evicted four times and never committed. Each CVE should give one output record, but the thread had written 17 records for only 7 CVEs, the first few of each partition, again and again. Left running, it would have written more records for the same 7, and never reached the rest of the backlog.
The 30-second poll interval is the default of 300 scaled down tenfold, only to keep the run short. Later sections call these runs the scaled runs. At the default, the same case is thirty tasks and a 12-second call. Thirty tasks is what the default of one thread gets from a topic with thirty partitions, and an AI model writing a long answer can take 12 seconds. Or it is three tasks and a 120-second call. A call can take that long when the service is overloaded, or when the client retries with backoff. Several later runs use a 120-second call on a single task. What counts is the round, and ten tasks at 12 seconds make the same 120-second round. One task is simply easier to follow.
The commit interval is the other clock
With slow calls, leave commit.interval.ms at its default. Raising it saves
little, and it opens a way to be evicted. The mechanism still matters, because a
pass without a commit is also how a later case ends in an eviction:
a thread whose service slows.
The round is not the whole story. How many rounds a thread runs before it polls
depends on commits, as the loop shows. A commit is due when
commit.interval.ms
has passed on the thread’s commit clock, which starts at the last commit
(maybeCommit).
A pass that commits halves N, the number of records each task runs in a pass. A
pass without a commit grows it.
The defaults are a 30-second commit interval against a 300-second poll interval. Every pass longer than 30 seconds then commits, so N stays at 1, and a thread whose round fits the poll interval polls in time. That holds for a latency that has been steady since the thread started, and in a group with no rebalance under way. The first condition comes back below, and the second in a coming post. We checked it without scaling: one task, a 120-second call, 15 minutes. The thread committed after every record and never rebalanced, and the output held 7 records of 7 CVEs.
Each commit costs work: the thread flushes its state stores and writes its
offsets, and processes nothing meanwhile. Raising commit.interval.ms saves
some of that, which can buy throughput. With calls that take seconds, the saving
is small, and the cost is what follows.
Raise commit.interval.ms above the length of a round, and a pass can end with
no commit due. We ran the same one-task, 120-second call with both intervals at
300 seconds. The first pass after the poll ended at 120 seconds. That was not
past the half-way mark of 150, and no commit was due. So N went to 2, and the
next pass took two records, another 240 seconds. The thread could poll again
only at 360 seconds, past the poll interval. A rebalance followed at 363.8
seconds, and the output held 7 records for 4 CVEs.
We call the range this round falls in the band: longer than a third of the poll interval, shorter than half. A round in the band ends its first pass before the half-way mark, so the thread does not poll. With no commit due, N goes to 2, and the second pass takes two rounds. The thread can poll only after three rounds, and three rounds run past the interval. A round under a third survives, because three rounds still fit. A round over half survives too, because its first pass crosses the half-way mark and the thread polls.
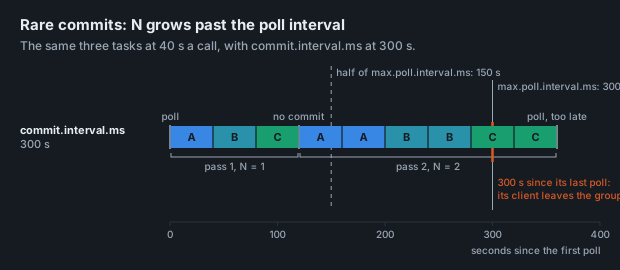
It is the client that leaves. When the poll timer expires, its own heartbeat thread sends the leave, and the processing thread learns of it at its next commit.
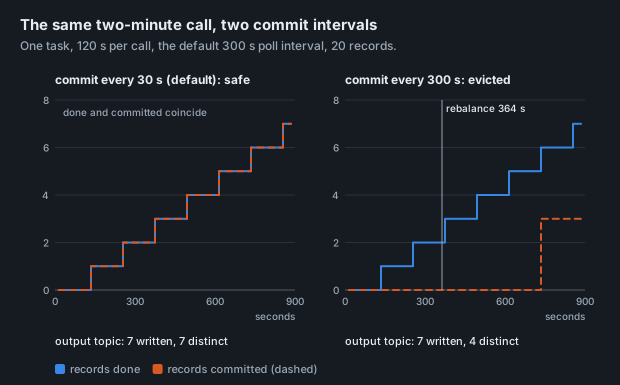
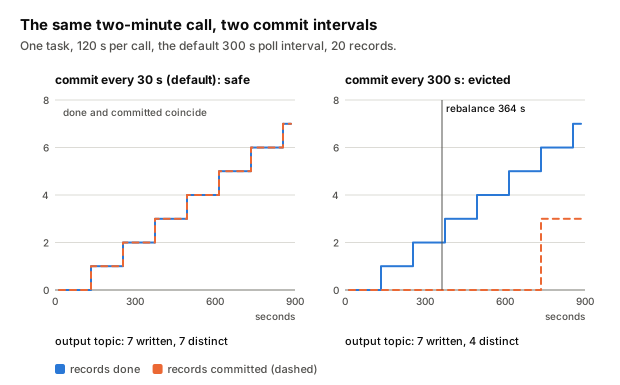
Runs on both sides of the band agree. In the scaled runs, the commit interval was left at 30 seconds against a 30-second poll interval, so commits were rare by accident. A round of 12 seconds (0.4 of the poll interval) was evicted and wrote 96 duplicates in 256 records. Rounds of 9 seconds (0.3) and 17 seconds (0.57) were not. One case needs care even at the defaults. A round just under half polls only after two rounds, seconds before the poll interval runs out. We measured the band with the commit interval equal to the poll interval. Other settings above the round follow from the loop, not from a run.
The same clock explains a smaller oddity. Commits land later than the commit interval says: about 35 seconds apart with a 300 ms call, and 35 to 40 with a 3-second one in a scaled run. A commit waits for the pass in progress, and between commits the passes grow by a round each. Apurva Mehta and A. Sophie Blee-Goldman’s exactly-once guide calls the commit interval a lower bound, and this is why.
After an eviction
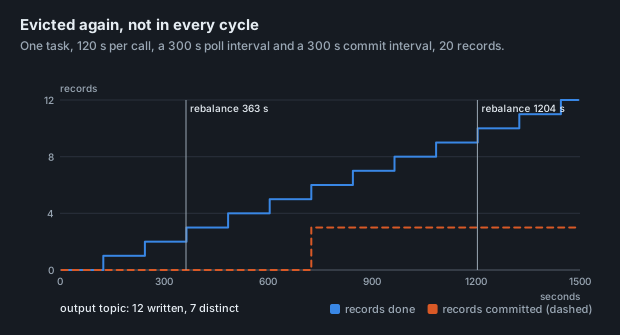
Go back to the band run of the last section: one task, a 120-second call, and both intervals at 300 seconds. It was evicted, and rebalanced at 363.8 seconds. Our first reading of the loop said it would then be evicted every time it rejoined, since it would start the same way again. It was not. After rejoining, it kept its place, because a rebalance is not a fresh start. One thing survives it that a restart would reset, and one thing restarts.
N survives. The failed commit that reveals the eviction throws from the commit check, before N is adjusted, and N is reset only when the thread starts. So the first pass after rejoining took two records, 240 seconds, crossed the half-way mark and polled in time.
The commit clock restarts. The clock counts the time since the last commit. Once it passes the commit interval, the next commit check commits, and restarts the clock even when there is nothing to commit (line 1881). After the rejoin, the task needs a moment to start, and the thread runs a few passes that process nothing. The first of them finds a commit overdue, commits nothing and restarts the clock. So the next real commit falls due 300 seconds after the rejoin. The log does not show those empty passes. We inferred them because nothing else fits the timings, and we predicted the next eviction from them.
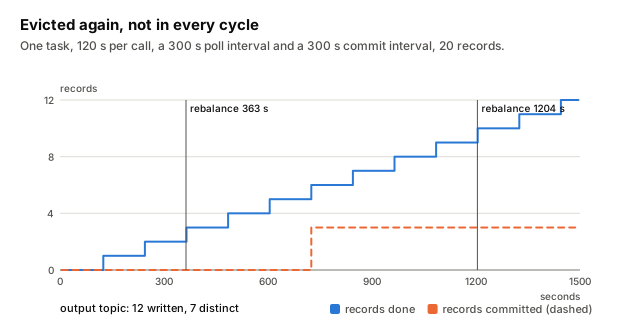
We ran the same settings again for 1,500 seconds, and they did what that predicted. The thread rebalanced at 363.4 and 1,203.9 seconds, committed once between them at about 725, and wrote 12 records for 7 CVEs. A thread in the band is evicted again, but not every time it rejoins. When depends on where N and the commit clock stand. Each eviction costs the calls made since the last commit, made and written again.
When a fast thread’s service slows down
That N survives a rebalance has a consequence that matters more than the band, and it needs no setting raised. N has no upper limit in the code. It grows by one after every pass that neither committed nor punctuated, however few records the pass held. A stream that keeps up therefore carries a large N. Ours, at 25 records a second with the service answering at once, reached 221 in two minutes. A pass runs at most N records per task, but only the records waiting in the queues. So a large N means a pass takes everything waiting.
A commit halves N only when the check falls on a pass that held records. On an idle pass it leaves N alone, and most passes of a stream that keeps up are idle. In another run of the same two minutes, one check did land on a pass with records, and N ended at 124. Kafka logs N at DEBUG in every pass, as “iterations”, which is where these numbers come from (line 1283).
Then we slowed the service to 10 seconds a call, a thirtieth of the poll interval, with 40 records waiting and every setting at its default. The thread took the 40 as one pass of 400 seconds, with no look at the clock inside it. The poll timer expired at 300. The pass’s commit, the first attempt in 415 seconds, failed. N was 222 after the rebalance as before it, so the next pass was the same records again. It was evicted every time it rejoined: 401, 811 and 1,222 seconds after the slow-down, and a fourth was under way when the run ended. In all, 155 records were written for 41 CVEs, 154 of them from calls of 10 seconds, and not one was committed.
The same 40 records at the same 10 seconds were no trouble for a thread that starts on them. N went 1, 2, 1, 2, with a commit after every second pass. There was no rebalance, and all 40 were done in about 400 seconds. The two threads differ only in their history. No setting states it, and nothing about the slow call shows it.
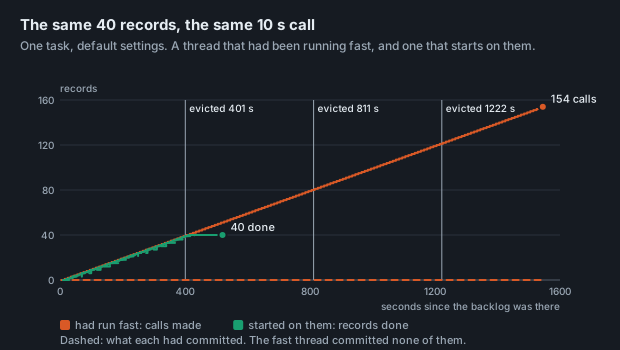
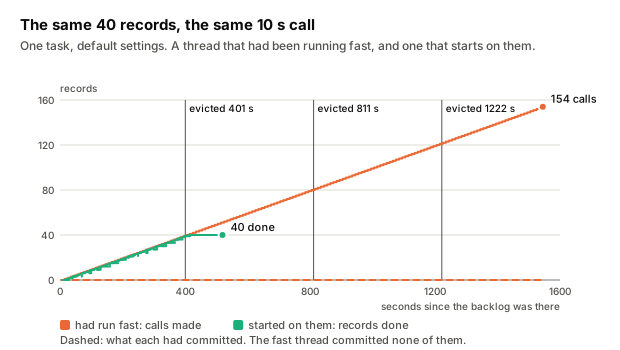
Ten seconds after an instant answer is an extreme slow-down. We chose it so that one run would be short and leave no doubt. The arithmetic of the loop puts the line much lower. With N at 222 and that many records waiting, a pass is 222 calls back to back. It has to end within the 300-second poll interval, so each call can take at most 300 ÷ 222, about 1.35 seconds. Any slower, and one pass outlasts the poll interval. The 222 is measured. The 1.35 seconds is only that division: we did not run a slow-down to it.
One more condition belongs here. We placed the backlog whole: the thread was
held in one call while the 40 arrived, so that its next poll returned all of
them. A backlog that builds by itself reaches the thread one poll at a time.
Each pass then takes what arrived during the one before. When records arrive
faster than the service answers, each pass is longer than the last. Arriving
more slowly is not enough on its own: a backlog already waiting is taken in one
pass, up to max.poll.records of it, and that pass still has to fit the poll
interval. This follows from the loop, and we did not run it either.
The thread does not get out by itself. Each time it rejoins, N is still 222, the
pass is the same 40 records, and the commit that would halve N is the one that
fails. Only a new thread starts N at 1 again. Restarting the instance gives one,
and so does replacing the thread at runtime with
removeStreamThread()
and
addStreamThread().
The thread that started on the backlog shows what follows. A restart redoes the
uncommitted records once. It is a cure, not a prevention: once the service is
fast again, N grows back, and the next slow-down sets the same trap. To stay
out, cap max.poll.records, so that a poll’s worth of slow calls fits inside
the poll interval. It saved this thread with nothing else changed, as
the levers below show.
The levers, and what each costs
max.poll.interval.ms. Raising it lets a longer round fit, so a thread that
was being evicted keeps its place and its calls are not made again. It adds no
throughput: a stream that was being evicted falls behind quietly instead. And
it has two costs.
The first: a thread that is alive but stuck, on a call with no timeout, keeps its partitions until the poll interval runs out. A process that dies is still noticed sooner, by the session timeout, because heartbeats come from a thread of their own.
The second: with the classic protocol, the default, a rebalance waits for every member to rejoin, up to the poll interval, as Blee-Goldman’s guide to rebalancing describes. A busy thread rejoins only after the pass that takes it past half the poll interval. So with a 30-minute poll interval, a new instance can wait 15 minutes for its tasks, and longer by however long that pass takes. That follows from the loop, and we did not measure it. Until Kafka 2.3, Streams set this interval to effectively infinite. KIP-442 returned it to the consumer’s default.
commit.interval.ms. Lowering it means more commits, and each one is a flush
and an offset write during which the thread processes nothing. Raising it above
the length of a round opens the band from a third to a half of the poll
interval. Keep a round under a third then.
max.poll.records. Streams sets it to 1,000, and every run but one left it
there. It caps what one poll hands the thread. For a thread whose N is larger
than that, it caps the pass. We ran the fast stream that slows once more, with
nothing changed but this setting, at 20. The poll returned 20 of the 40 waiting
records, and the pass was 200 seconds. Its commit went through with 100 seconds
to spare and halved N, and the other 20 went the same way. There was no
eviction, and each record was done once, where at the default it had been
evicted every time it rejoined.
KAFKA-14382 names lowering
it as a workaround that shortens the processing loop. This is that, measured for
one value. By the loop, the rule is that a poll’s worth of calls has to fit the
poll interval: max.poll.records times the call. What it costs a stream while it is
fast, more polls for the same records, we did not measure.
More instances. They add threads, and threads add throughput when a round fits. They do not rescue a round in the band. A coming post shows that a second instance made the repeated work worse.
For a long call, then, these settings keep a thread in its group. Start with a
timeout on every call, retries included. The other settings rest on it: without
a timeout, no record has an upper limit, and no setting is safe. Keep
commit.interval.ms at its default, below a round, so every pass commits and N
stays at 1. Give each thread few enough tasks that a round fits well inside the
poll interval. Cap max.poll.records so that a poll’s worth of calls at the
timeout fits too. That cap is what kept the thread whose service slowed. Raise
max.poll.interval.ms last, for the costs above.
What we did not measure
A single machine with one broker, and a stub whose latency has no tail. A round just under half the poll interval has no margin for one.
A latency that changes, beyond one case. Every run but two held the call’s
latency steady from the start. The fast stream that slows was run twice, at 10
seconds, on one task, with its backlog placed whole: once at the default
max.poll.records, and once at 20. A slow-down that comes
gradually, a backlog that builds by itself, a service that recovers while a
pass is under way, and other latencies are readings of the loop.
Exactly-once. Every run was at-least-once. A transactional commit takes another path through the broker, and the commit interval’s default is different.
Kafka Streams 4.2.0 only. In that version, restoration runs on a separate state-updater thread by default, which is one way the loop can differ from older versions. We make no claim about any version whose source we have not read. Nor do we claim anything about the loop with processing threads, which 4.2.0 keeps switched off.
And one thing we saw and have not explained. In the run of The unit is the round, three tasks at 12 seconds against a 30-second poll interval, the rebalances came 36 seconds apart. Once, the gap was 72. If you know why, or have seen the same on your own cluster, tell us in Discussions. We will add what we learn to this post.
How the numbers were made
Every run was written down as a prediction before it ran. Its result was added after, without editing the prediction. The early runs were predicted from a model of the loop, the later ones from its source.
Several predictions were wrong, two of them about the mechanism. The first
model, one round per poll, predicted that one task per thread would make a
12-second call safe against a 30-second poll interval. It was evicted. Reading
StreamThread is how we found the adaptive pass. Sax’s talk, which we found
afterwards, explains it too. The prediction for the
120-second call with rare commits rested on a false detail, that the first pass
would commit, so its eviction came earlier than predicted. Two more missed a number: commits predicted
30 seconds apart came 35 apart, and one end count was an arithmetic slip.
A note on names, for readers who open the source. The field that holds N is
called numIterations. Kafka’s
thread metrics
count an iteration as one poll and all the processing after it, which can hold several
passes. We say pass to keep the two apart.
The stub, the replay script and the application are not published. If you want to run them against your own numbers, write to info@alginte.com and we will send them.
This post is one of a few on calling a service from Kafka Streams. A coming one starts from the timeout on every call: how to make sure a call is really cut off, and the arithmetic that then says which settings are safe. To get it, follow the blog’s RSS feed or @alginte_sw on X, where we post each one.
Related reading
- Matthias J. Sax, The Nuts and Bolts of Kafka Streams (Current 2023): the architecture this post rests on, from the threading model to restoration.
- A. Sophie Blee-Goldman, Kafka Streams 101: Optimizing your apps (2025): the round, in one sentence.
- KAFKA-14382: stream threads that process too long miss rebalances, and what shortens it.